 e9b687d983
Replace the flat billboard-disc planets with real 3D EllipsoidGraphics spheres textured with self-hosted high-res NASA/JPL + Solar System Scope maps (hd_*.jpg, 2048x1024), plus a PlaneGraphics Saturn ring (top-down annulus, transparent centre, depth-tested occlusion). Constant axial tilts (Venus upside-down, Uranus on its side). Cesium gotchas handled: constant orientation (time-varying orientation drops image materials -> blank white); DirectionalLight intensity 0.42 (no HDR -> higher clamps bright maps to white); camera.flyTo is dead in this mode so enter/travel run a manual eased setView tween (flyCamera); ellipsoid+ring gated by distanceDisplayCondition(r*30) so the orrery overview stays clean colored dots and the textured sphere takes over up close. Drop 9 now-unused 2k_ maps; textures/ is 3.3MB. Co-Authored-By: Claude Fable 5 <noreply@anthropic.com> |
||
|---|---|---|
| .claude | ||
| css | ||
| docs | ||
| js | ||
| textures | ||
| .gitignore | ||
| index.html | ||
| PORTAL_BRIEF.md | ||
| README.md | ||
| record.py | ||
| serve.py | ||
| SPEC2.md | ||
| SPEC3.md | ||
| SPEC4.md | ||
| SPEC.md | ||
GODSIGH ▸ World View
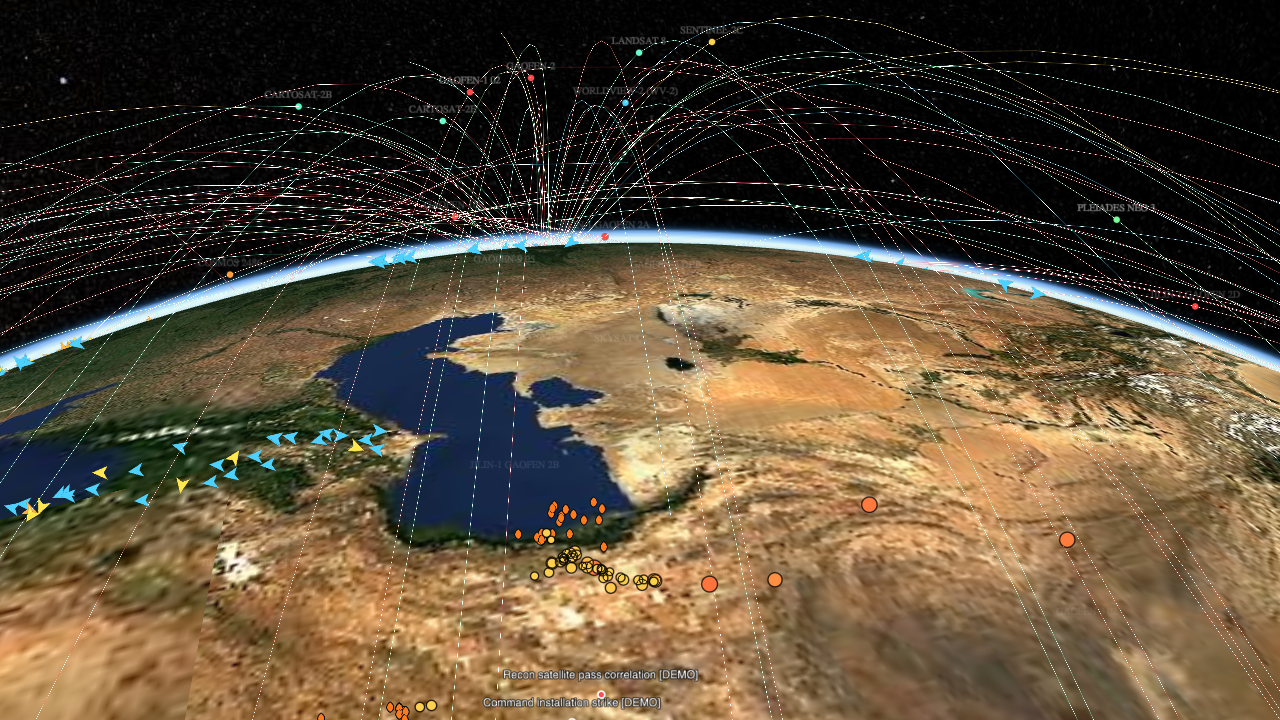
A browser-based 3D/4D OSINT world view — a CesiumJS digital-twin globe that fuses independent, public sensor feeds onto one scrubbable timeline. Satellite orbits, live aircraft, ship traffic, and energy infrastructure, all synced to a single space-time slider. Inspired by Bilawal Sidhu's God's Eye View.
Everything runs client-side from free, public, unclassified data. No API keys are required. No Cesium ion token. No build step.
Quickstart
python3 serve.py 8137
# open http://127.0.0.1:8137
serve.py is a zero-dependency (stdlib-only) static server that also proxies the two feeds a browser can't call directly. Open the page and the globe boots over the Persian Gulf; give the satellites a few seconds to propagate.
What you're looking at
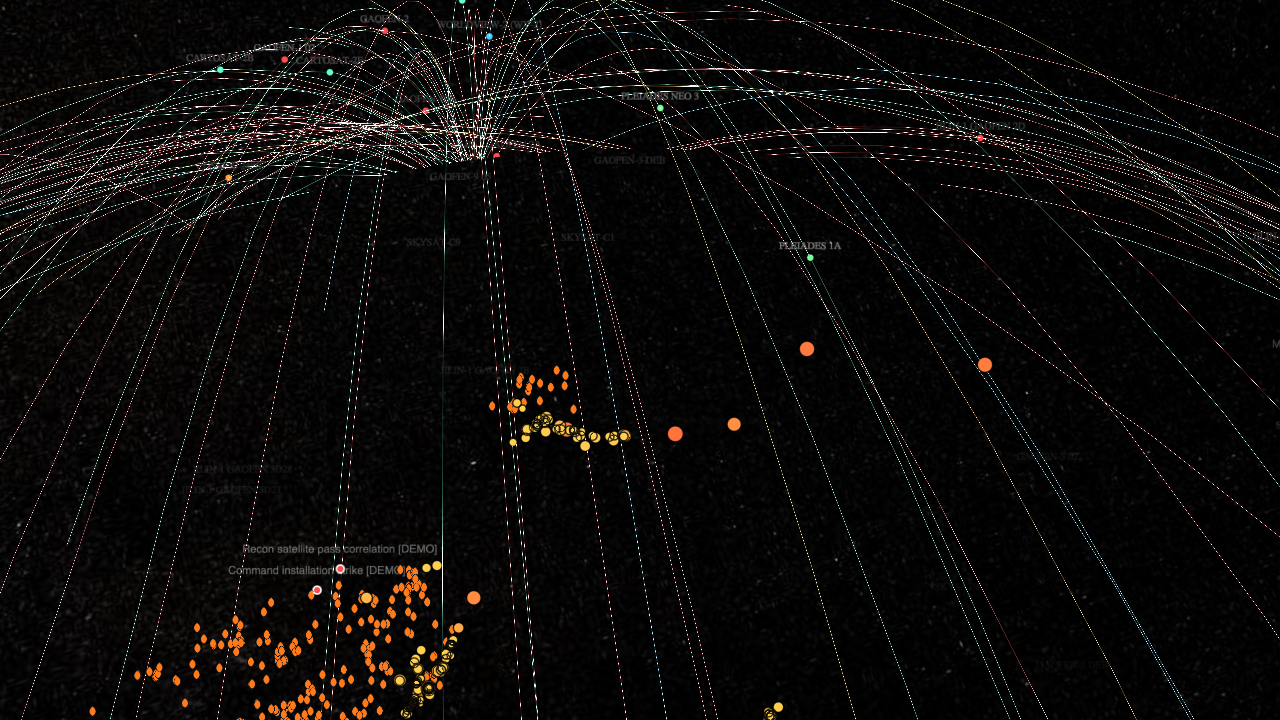
A dark digital-twin globe with the built-in Cesium timeline + animation widget along the bottom acting as the space-time slider — scrub it and every time-aware layer moves with the clock (now ±6 hours). Two rendering skins, toggled top-left:
- Data Mode — a flat, high-contrast dark basemap for asset tracking (the default).
- Photo Mode — Sentinel-2 satellite imagery with a live day/night terminator.
The HUD lists every layer with a live status line and an on/off toggle, plus a LIVE / SCRUBBED chip that shows when you've scrubbed off wall-clock-now (at which point the live-only layers pause to save quota).
Layers & data sources
| Layer | Source | Live? | Notes |
|---|---|---|---|
| Satellites (~97) | Celestrak GP/TLE | ✅ deterministic | SGP4-propagated orbits with glowing paths; EO/recon birds incl. WorldView, Pléiades, Capella, SkySat, plus Chinese Gaofen and Russian Cosmos (Persona) military satellites. Click one for orbital elements. |
| Aircraft | OpenSky Network ADS-B | ✅ live | Thousands of live flights, colored by altitude band; military callsigns highlighted and filterable; click one for callsign/country/altitude/speed/heading. Scrub off-live and it replays recorded traffic (see below). |
| Earthquakes | USGS GeoJSON | ✅ real | Last 24 h of quakes, time-anchored so each appears as the slider crosses its origin time; magnitude ramps amber→red, recent quakes pulse, M≥4.5 labeled. Click one for magnitude/depth/time and the USGS event link. |
| Wildfires | NASA EONET | ✅ real | Active wildfire events worldwide as flame glyphs; click one for the event details and EONET link. |
| Military | adsb.lol /v2/mil |
✅ real | Unfiltered military ADS-B the civil feeds hide (Reach airlift, tankers, the Area 51 "Janet" shuttle). Free & keyless; emergency squawks highlighted. |
| Disasters | GDACS | ✅ real | Global multi-hazard alerts (quake/cyclone/flood/volcano/drought) colored by alert level. (off by default) |
| Severe weather | US NWS | ✅ real | Active US severe-weather alerts. (off by default) |
| Rocket launches | The Space Devs | ✅ real | Upcoming launches at their pads with a T- countdown. (off by default) |
| NSW bushfires | NSW RFS | ✅ real | Current major bushfire incidents (Advice/Watch/Emergency). (Regional — Australia, off by default) |
Ships [DEMO] |
synthetic | — | Illustrative tanker traffic through the Strait of Hormuz, incl. a "toll-route" carrier, a dark-vessel AIS gap, and the Fujairah idle anchorage. Optional live AIS — see below. |
| Infrastructure | static vectors | — | Choke points (Hormuz, Bab el-Mandeb, Suez, Malacca), the East–West Petroline & Habshan–Fujairah pipelines, and key oil/desal/base facilities. Coordinates approximate. |
Events [DEMO] |
synthetic | — | Time-anchored markers that appear as the slider crosses their moment — illustrative placeholders for a future real event feed. |
Select a satellite and its sub-satellite ground track draws under it. In Data Mode, the whole picture reads as orbits + markers on a dark globe:
Basemaps
- Data Mode: © OpenStreetMap contributors © CARTO (dark_all raster tiles).
- Photo Mode: Sentinel-2 cloudless by EOX — modified Copernicus Sentinel data 2023.
What is real vs. DEMO
Real, live, public data: satellites (Celestrak TLEs), aircraft (OpenSky ADS-B), earthquakes (USGS), and wildfires (NASA EONET). Satellite positions are computed live via SGP4; aircraft are polled from OpenSky; quakes and fires are fetched directly from their public feeds.
Synthetic [DEMO] data: ships and events. These are hand-authored to illustrate the kind of analysis the platform is built for (dark-vessel detection, choke-point pressure, strike/pass correlation) without claiming to depict a real event. Every demo entity is labeled [DEMO] in its name, the HUD, and its info panel.
OpenSky's anonymous API has a small daily quota (~400 credits; a global snapshot costs 4). The aircraft layer polls every 90 s only while the tab is focused and the clock is live, and shows the remaining quota in its status line. If you hit the limit it backs off and says so.
Optional: live AIS ship tracking
The demo fleet is the default. To show real ship traffic, get a free key from aisstream.io and set it in js/config.js:
AISSTREAM_API_KEY: 'your-key-here',
On the first live position report the demo fleet hides and real vessels stream in over a WebSocket (no proxy needed).
Time-travel: aircraft replay
Orbits, demo ships, quakes and events are all time-aware, so scrubbing the timeline "just works" for them. Live aircraft are different — you can't compute where a plane was an hour ago. So an optional local recorder, record.py, snapshots live traffic every 3 minutes into a small SQLite db (data/history.db, gitignored, 72 h retention). Scrub the clock off wall-clock-now and the aircraft layer fetches the nearest recorded snapshot and replays the actual traffic for that moment — the aircraft status turns amber (replay · <time> · N aircraft). Where no recorder ran (e.g. production), the history endpoint returns 404 and the layer simply falls back to hiding aircraft when scrubbed.
python3 record.py # run alongside serve.py; heartbeat at ~/.jobs/godsigh-recorder.status
The recorder fetches through the same proxy the app uses, so it shares the OpenSky quota rather than competing for it (see below).
Shared OpenSky cache
serve.py caches the global OpenSky /states/all response at ~/.cache/godverse/opensky-states.json for 120 s. Any global request within that window is served from cache (X-Godsigh-Cache: hit) instead of spending quota, and on a 429 the last-known snapshot is served stale (X-Godsigh-Cache: stale) so the app keeps working through quota exhaustion. This lets GODSIGH, its recorder, and the sibling godstrument project all poll from one machine without racing into the small anonymous daily quota.
Shareable links
The current view is continuously serialized into the URL hash — camera, render mode, which layers are on, and the timeline position. Copy the URL and share it, and it reopens at exactly that camera, mode, layer set, and clock offset. Example:
#c=53.000,25.500,2800000,0.000,-90.000&m=d&L=satellites,sat-paths,infra,events,quakes,fires,ships,aircraft&t=0
Architecture
No framework, no bundler — vanilla ES modules plus two CDN globals (CesiumJS, satellite.js).
index.html            CDN script tags, HUD shell, #cesiumContainer
css/style.css         dark HUD styling
js/config.js          all URLs, intervals, camera, colors, keys — one file
js/lib.js             shared helpers (glyphs, bearing, color bands)
js/ui.js              HUD: layer rows, status lines, LIVE/SCRUBBED chip
js/main.js            viewer bootstrap, basemaps, clock, gating, picking, loader, URL-state sync
js/layers/*.js        one module per layer (satellites, aircraft, ships, infra, events, quakes, fires)
serve.py              dev server + same-origin proxy, shared OpenSky cache, history + snap endpoints
record.py             optional dev daemon: snapshots live aircraft into data/history.db for replay
Why the proxy? OpenSky pins its CORS header to its own domain, so a browser can't fetch it cross-origin. serve.py (dev) and nginx (prod) forward proxy/opensky and proxy/celestrak from the same origin. Every URL in the app is relative, so it works unchanged at / and at /godsigh/.
Entities vs. primitives: satellites, ships, infrastructure, and events are Cesium entities (time dynamics + click InfoBox for free). Aircraft/military are BillboardCollection primitives — thousands of them, rebuilt each poll — with a custom click overlay.
The layer registry: most feeds are the same shape (fetch GeoJSON-ish data, drop styled markers, report status), so they're data, not code — one object literal per layer in js/registry.js, rendered by the generic factory in js/layers/geojson-layer.js. Quakes, fires, disasters, severe weather, launches, and NSW bushfires all live there; adding another public feed is a registry entry. Layers with real per-layer logic (satellites' SGP4, aircraft/military billboards, the demo ships) stay as their own modules.
Roadmap
- Live AIS by default (aisstream.io key) — implemented, opt-in today.
- Historical recording — implemented locally via
record.py(see Time-travel above); a VPS-side recorder for replay in production is a future step. - GPS-jamming heatmap from gpsjam.org daily H3 tiles — investigated, held pending permission. The data is real and clean:
https://gpsjam.org/data/<YYYY-MM-DD>-h3_4.csv(published ~04:00 UTC for the prior day), columnshex,count_good_aircraft,count_bad_aircraft— an H3 resolution-4 index plus counts, easily rendered as translucent red hexes (interference =bad / (good + bad)). Two blockers stopped us building it: (1) the endpoint sends noAccess-Control-Allow-Origin, so a browser can't fetch it directly — aserve.pyproxy would be required; and (2) licensing is ambiguous — gpsjam.org publishes no license or reuse terms, and the data is derived from ADS-B Exchange (non-commercial, protective of redistribution). Re-serving it from a public site without an explicit grant would be scraping around an unwilling origin, so this waits on John obtaining permission from John Wiseman / ADS-B Exchange first. - Classified-sat amateur TLEs (community "classfd" catalogs) for birds Celestrak omits.
- Economic side panel — Brent / WTI oil futures synced to the timeline.
- Cesium ion terrain & photorealistic 3D tiles (needs a token).
- Agentic event ingestion — LLM/agent pipelines that task, scrape, and structure OSINT into the event feed.
Deployment
Target: https://partly.party/godsigh/ (games VPS, behind the forum-nginx container and Cloudflare). Only index.html, css/, and js/ ship; serve.py is replaced by nginx location blocks that proxy OpenSky/Celestrak. See SPEC.md §9 for the exact deploy steps.
Attribution & terms
- OpenSky Network — data under their terms; non-commercial use. https://opensky-network.org
- Celestrak — GP/TLE orbital data. https://celestrak.org
- CARTO / OpenStreetMap — basemap tiles. © OpenStreetMap contributors © CARTO.
- EOX — Sentinel-2 cloudless; modified Copernicus Sentinel data 2023. https://s2maps.eu
- CesiumJS, satellite.js — Apache-2.0 / MIT.
The Cesium credit display is kept visible in-app as a condition of these licenses.